Hello, inforgraphics
Inforgraphics are a very powerful tool for visual leaners.
 (Source:Canva)
But what is an infographic ? To better understand the infographic definition, it helps to know where the term came from. Infographic is a portmanteau of ‘information’ and ‘graphic’. An infographic (information graphic) is a visual representation of information that aims to make the data easily understandable at a first glance.
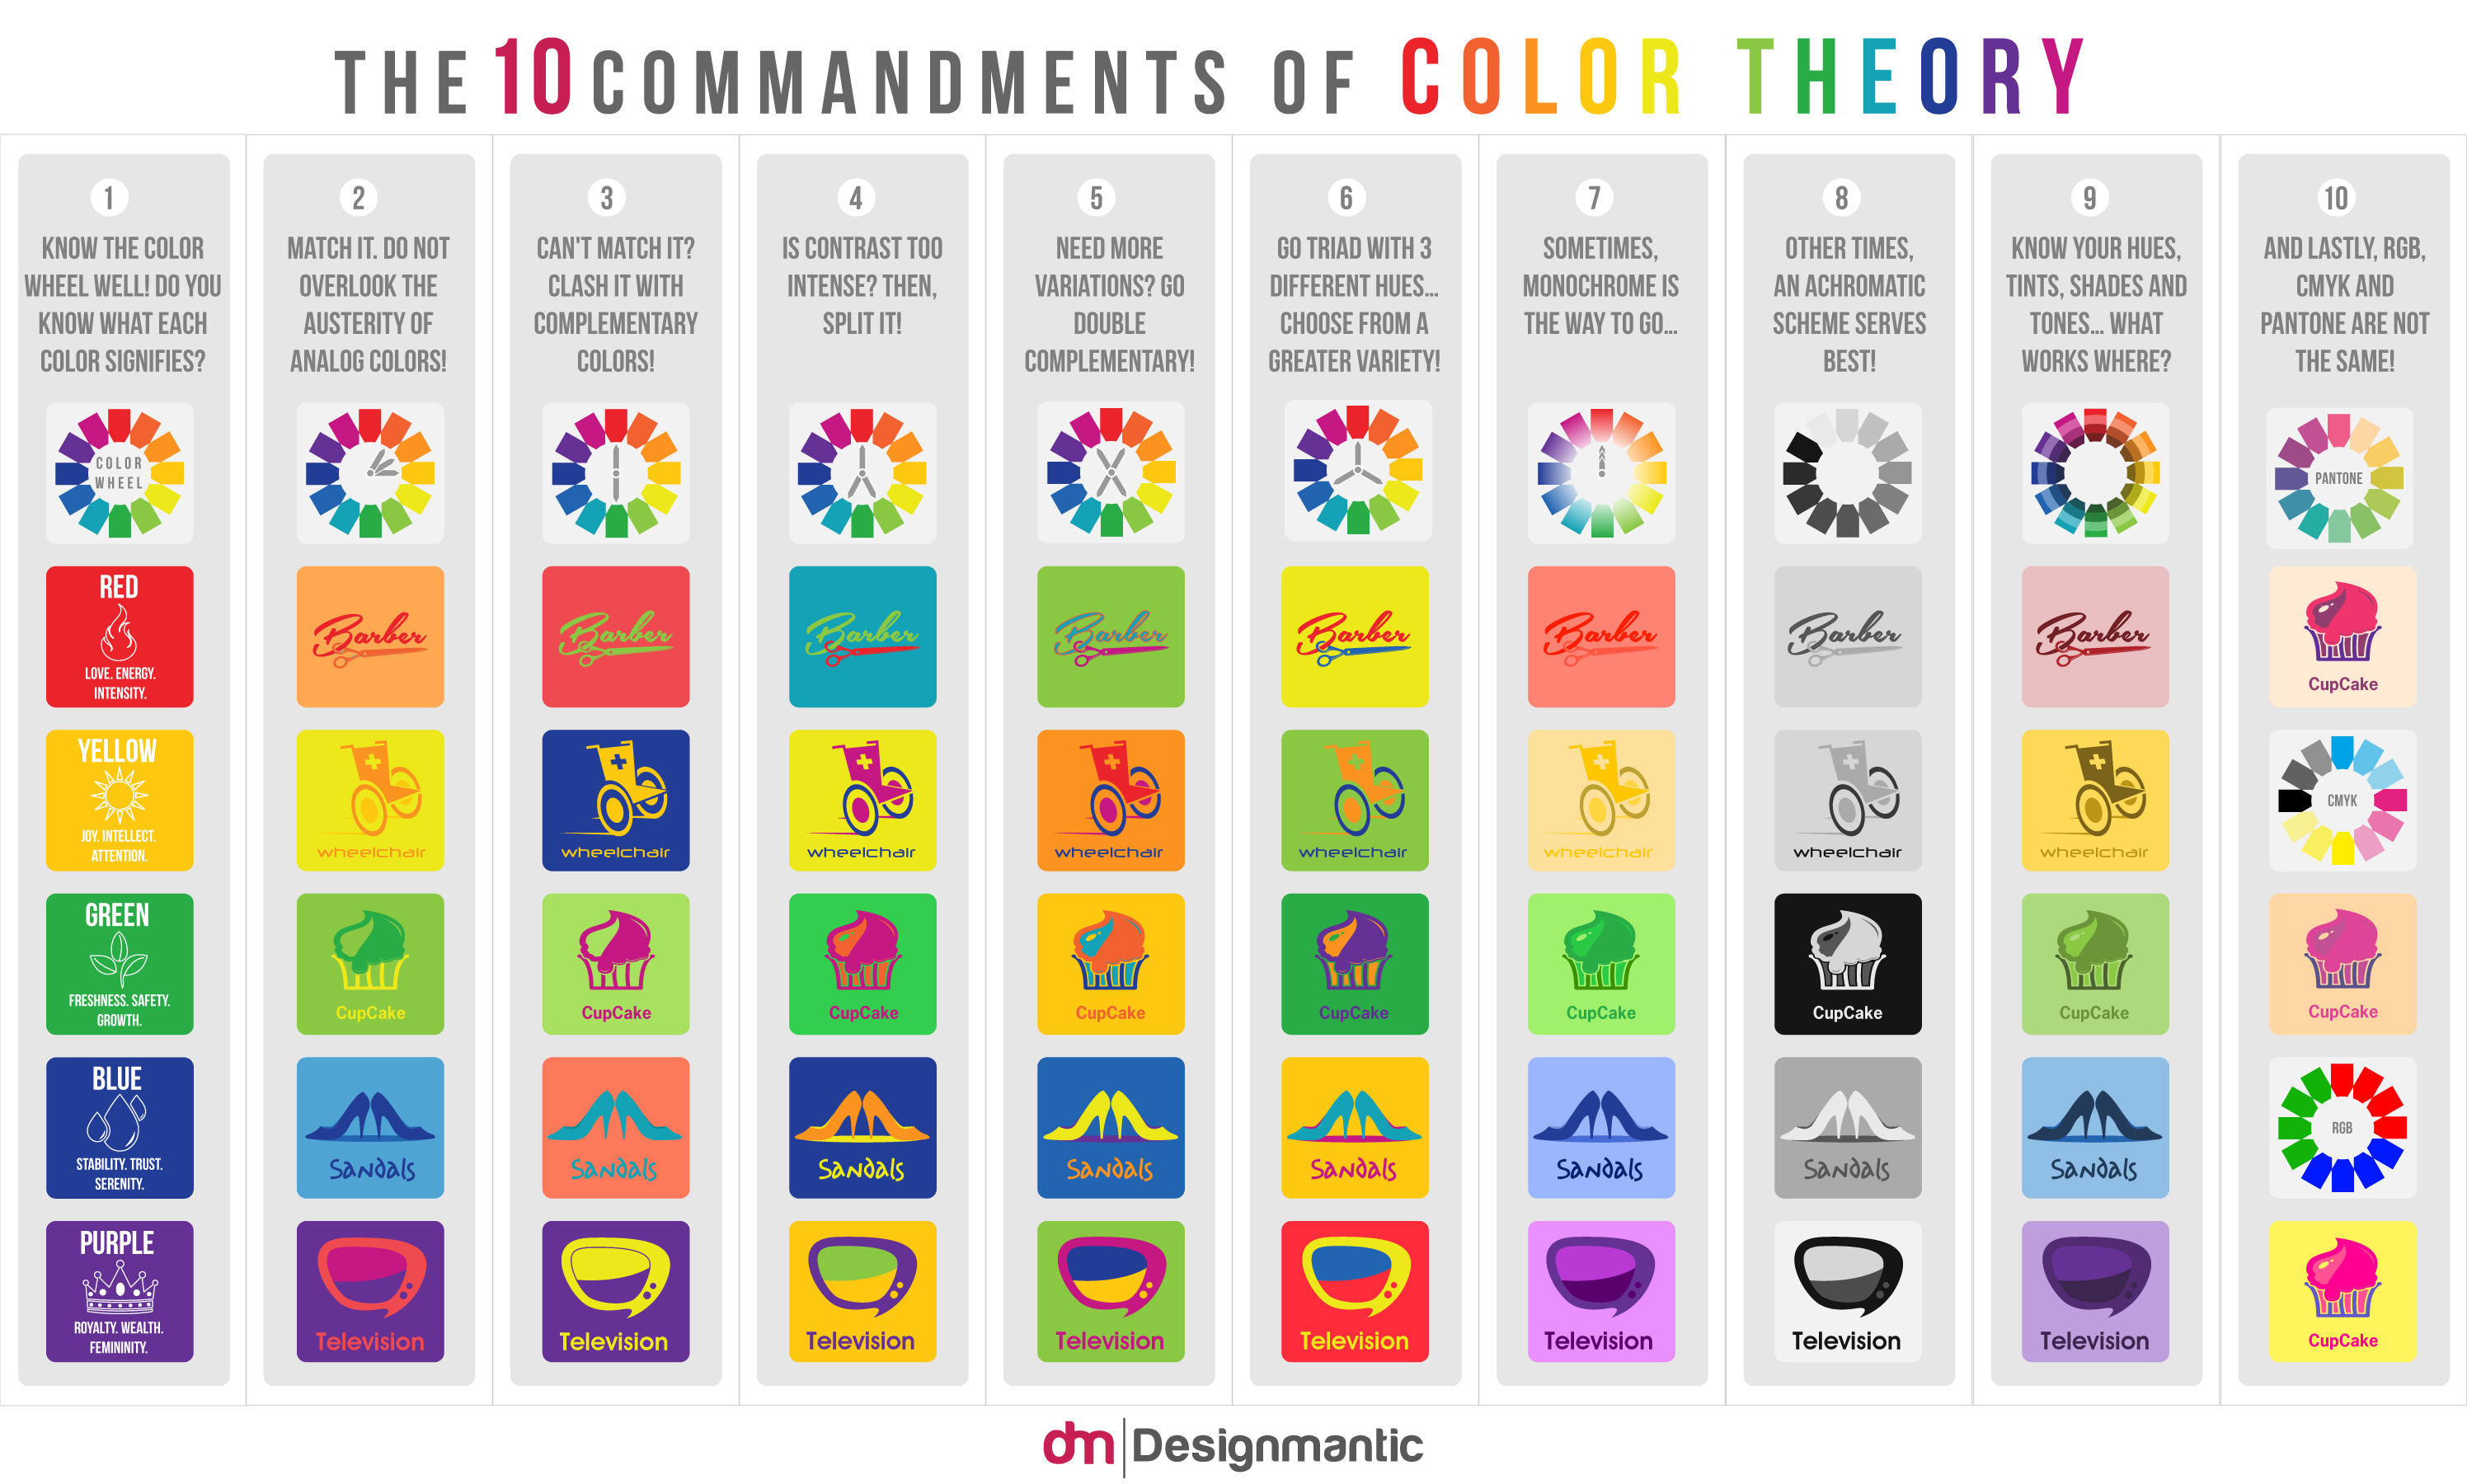
 (Source:DesignMantic)
An infographic makes minimal use of text and can be a powerful tool for displaying data, explaining concepts, simplifying presentations, mapping relationships, showing trends and providing essential insights. The use of compelling images on an infographic can make what is an abstract idea that much easier to understand (hence infographics popularity in marketing and instruction). Infographics simplify large data sets providing a high-level view and making them easier to digest at first glance. They help convey data in a compact and shareable form.
 (Source:DesignMantic)
While infographics are often viewed as a novel, they were actually an
early means of written communication as depicted by cave drawings and
image-centric languages such as Ancient Egypt’s hieroglyphics. In the
1920s, pictorial statistics known as isotypes and a key precursor to
today’s infographics were born. The onset of the computer and the
internet has only expanded its use. Learn more about this at
icons8
This page was crafted by Rosalie Taylor.